Research Minute: 3 Industries Where Utah May Face Talent Shortages


Each month, EDCUtah’s Research Minute highlights timely research insights and economic development data. This month, Michael Stachitus analyzes Utah’s potential occupational gaps over the next five years.
As Utah’s population and economy continue to grow rapidly, the demand for specific skills and experience in the workforce only continues to increase. As this demand for labor grows, Utah must be nimble and forward-thinking in its workforce development approach.
EDCUtah analyzed potential workforce demands over the next five years, and we identified three occupations that may become increasingly difficult to fill if current demand and market trends remain the same:
1. Healthcare Diagnosing or Treating Practitioners
2. Computer Occupations
3. Business Operations Specialists
The graph below provides a snapshot of the expected annual supply and deficit in occupations over the next five years. These are broad occupational groupings, with more specific occupations nested within each occupational category.

Healthcare remains a critical industry in Utah and continues to face challenges in meeting hiring demands. This challenge is not unique to Utah. The high demand for healthcare workers is a nationwide and potentially even global issue. As the median age in Utah and across the nation increases, healthcare needs are also expected to rise.

The gap leaves Utah with over 300 fewer registered nurses and nurse practitioners than the industry requires each year – which also means that existing nurses and hospital staff will have to shoulder the burden of increasing demand. Furthermore, there’s not a single surplus occupation in this healthcare category, meaning every occupation in the group faces a hiring deficit.
As technology innovation and artificial intelligence (AI) continue to drive economic growth in the U.S., computer occupations remain in high demand. The demand for software developers in Utah has remained high for over a decade and is expected to continue over the next five years.

Utah can address these occupational gaps by fostering strong alignment among workforce development initiatives, educational institutions, and industry needs. This includes investing in targeted training programs, apprenticeships, and certifications that align with high-demand sectors, while encouraging businesses to partner with schools and community colleges to shape curricula around in-demand skills. Utah is addressing these demands through key programs and initiatives, including Talent Ready Utah, Custom Fit, and Return Utah, three programs that connect companies to the workforce they need.
Data Sources: JobsEQ. For more information about occupational gaps, email us at connect@edcutah.org or explore the benefits of investing with EDCUtah.
_____
For additional information or to schedule an interview, please contact us.

Each month, EDCUtah’s Research Minute highlights interesting economic development data and timely research insights. This month, we discuss Utah’s infrastructure grades given by the American Society of Civil Engineers.
Utah’s infrastructure received a C+ grade from the American Society of Civil Engineers (ASCE) in their recent update of the state’s infrastructure report card. The professional society has been grading the nation’s infrastructure since 1988 but only began grading Utah separately in 2015., Since 2017, the state of the nation’s infrastructure has improved; moving from a D+ to a C in those eight years. Meanwhile, Utah has improved one grade: from a C to a C+ in the past 10 years. C+ is the highest infrastructure grade given to any state so far, with only two other states receiving a C+ (Georgia and Wisconsin in 2024).
The Utah Section of the ASCE graded 12 of Utah’s infrastructure categories, based on eight criteria. The best grade, A, represents infrastructure labeled as “exceptional, fit for the future”, while the worst grade, F, is labeled as “failing/critical, unfit for purpose.”
Most of Utah’s infrastructure grades have remained the same over the past 5 and 10 years. The Utah Section of the ASCE credits Utah leaders and infrastructure agencies with working “diligently to plan for and address all of Utah’s infrastructure needs, both rural and urban.” And while the state has done a good job at maintaining infrastructure over longer time-horizons, the steady C+ grade may also be an indicator that more investment is needed to ensure Utah’s long-term stability.
There are a few areas where the state has improved and others where it has declined. Looking at Utah’s infrastructure grades from 2015, 2020, and now 2025, here are five trends worth highlighting that demonstrate Utah’s trajectory in providing the necessary amenities to support its residents and economic stability now and in the future.
“Utah benefits from a developing Wasatch Front, but rural communities are key to the state’s continued success. Those communities need access to reliable clean water, functional roads, transit, flood control, and other necessities of life.”
– Utah Chapter of the American Society of Civil Engineers
Utah dropped two grades from a B+ to a B- on transit in the last five years after not changing in the five years prior. A rising population and higher-density population centers make multi-modal and public transportation more necessary than ever as space for traditional car travel becomes scarcer. The ASCE highlights several positives: the many funding initiatives for transit, Salt Lake City’s transit ranking as the tenth best among the nation’s largest cities, and the proximity of 95% of Utah’s population to transit options. However, they also suggest that making these modes of transportation more cost competitive, increasing access in rural Utah, and updating outdated infrastructure are necessary steps to improving the state’s transit grade.
Utah has maintained the same grade of D- for levees and D+ for canals over the last 10 years, emphasizing the critical needs of the state’s poorest graded infrastructure categories. According to ASCE, “Utah has nearly 100 miles of levees that have an average age of 63 years,” and many of them fail to meet the standards of the Army Corps of Engineers. Without increasing funding and updating levees, much of Utah’s population centers could be classified as flood plains and will affect how they are assessed and insured.
Similarly, canals are at risk of damage and contamination in their current state. Utah’s canals—many of which are earth embankments and ditches, historically used for private irrigation—are increasingly being used for stormwater and flood management. Updates could reduce the risk of significant damage while also decreasing natural water loss.
While Utah’s Bridges maintain a high grade of B, the grade dropped from a B+ in the last five years. The ASCE recommends more funding to maintain and operate the state’s bridges as they age. Initiatives such as UDOT’s Bridgefest showed positive momentum in the improvement of this critical infrastructure, but additional funding will be required to maintain the high standard that Utah has maintained in the past.
The grade for aviation increased from C to a C+ in the last five years, largely due to the increased capacity of the Salt Lake City International Airport. With a budget of $3.6 billion to invest in the new airport, phases 1 and 2 of its construction have been completed with the next phase currently underway. The ASCE suggests investing in rural Utah airports to maintain and improve connectivity statewide to further improve its grade.
Between 2015 and 2020, Utah’s grade for drinking water infrastructure improved from a C to a B-. The grade did not change in 2025, but the progress made in those first five years has been maintained. Utah has successfully reduced water use by 20 percent over the last 20 years, and additional reductions will be necessary as the population continues to grow. Fortunately, legislation has been put in place to require water planning to strategize conservation and resilience for the future.
With Utah’s population expected to increase by 66% by 2060, maintaining and improving infrastructure will be critical to support that growth. Additionally, businesses require reliable infrastructure to operate efficiently and sustain employment for future generations. Ongoing infrastructure investment, especially in key risk areas, will be critical to ensuring statewide “access to clean water, reliable transportation, flood control, and responsible waste management.”
_____
Want more data? Explore the benefits of investing with EDCUtah.
For additional information or to schedule an interview, please contact us.
View Utah’s 2025 Infrastructure report card.

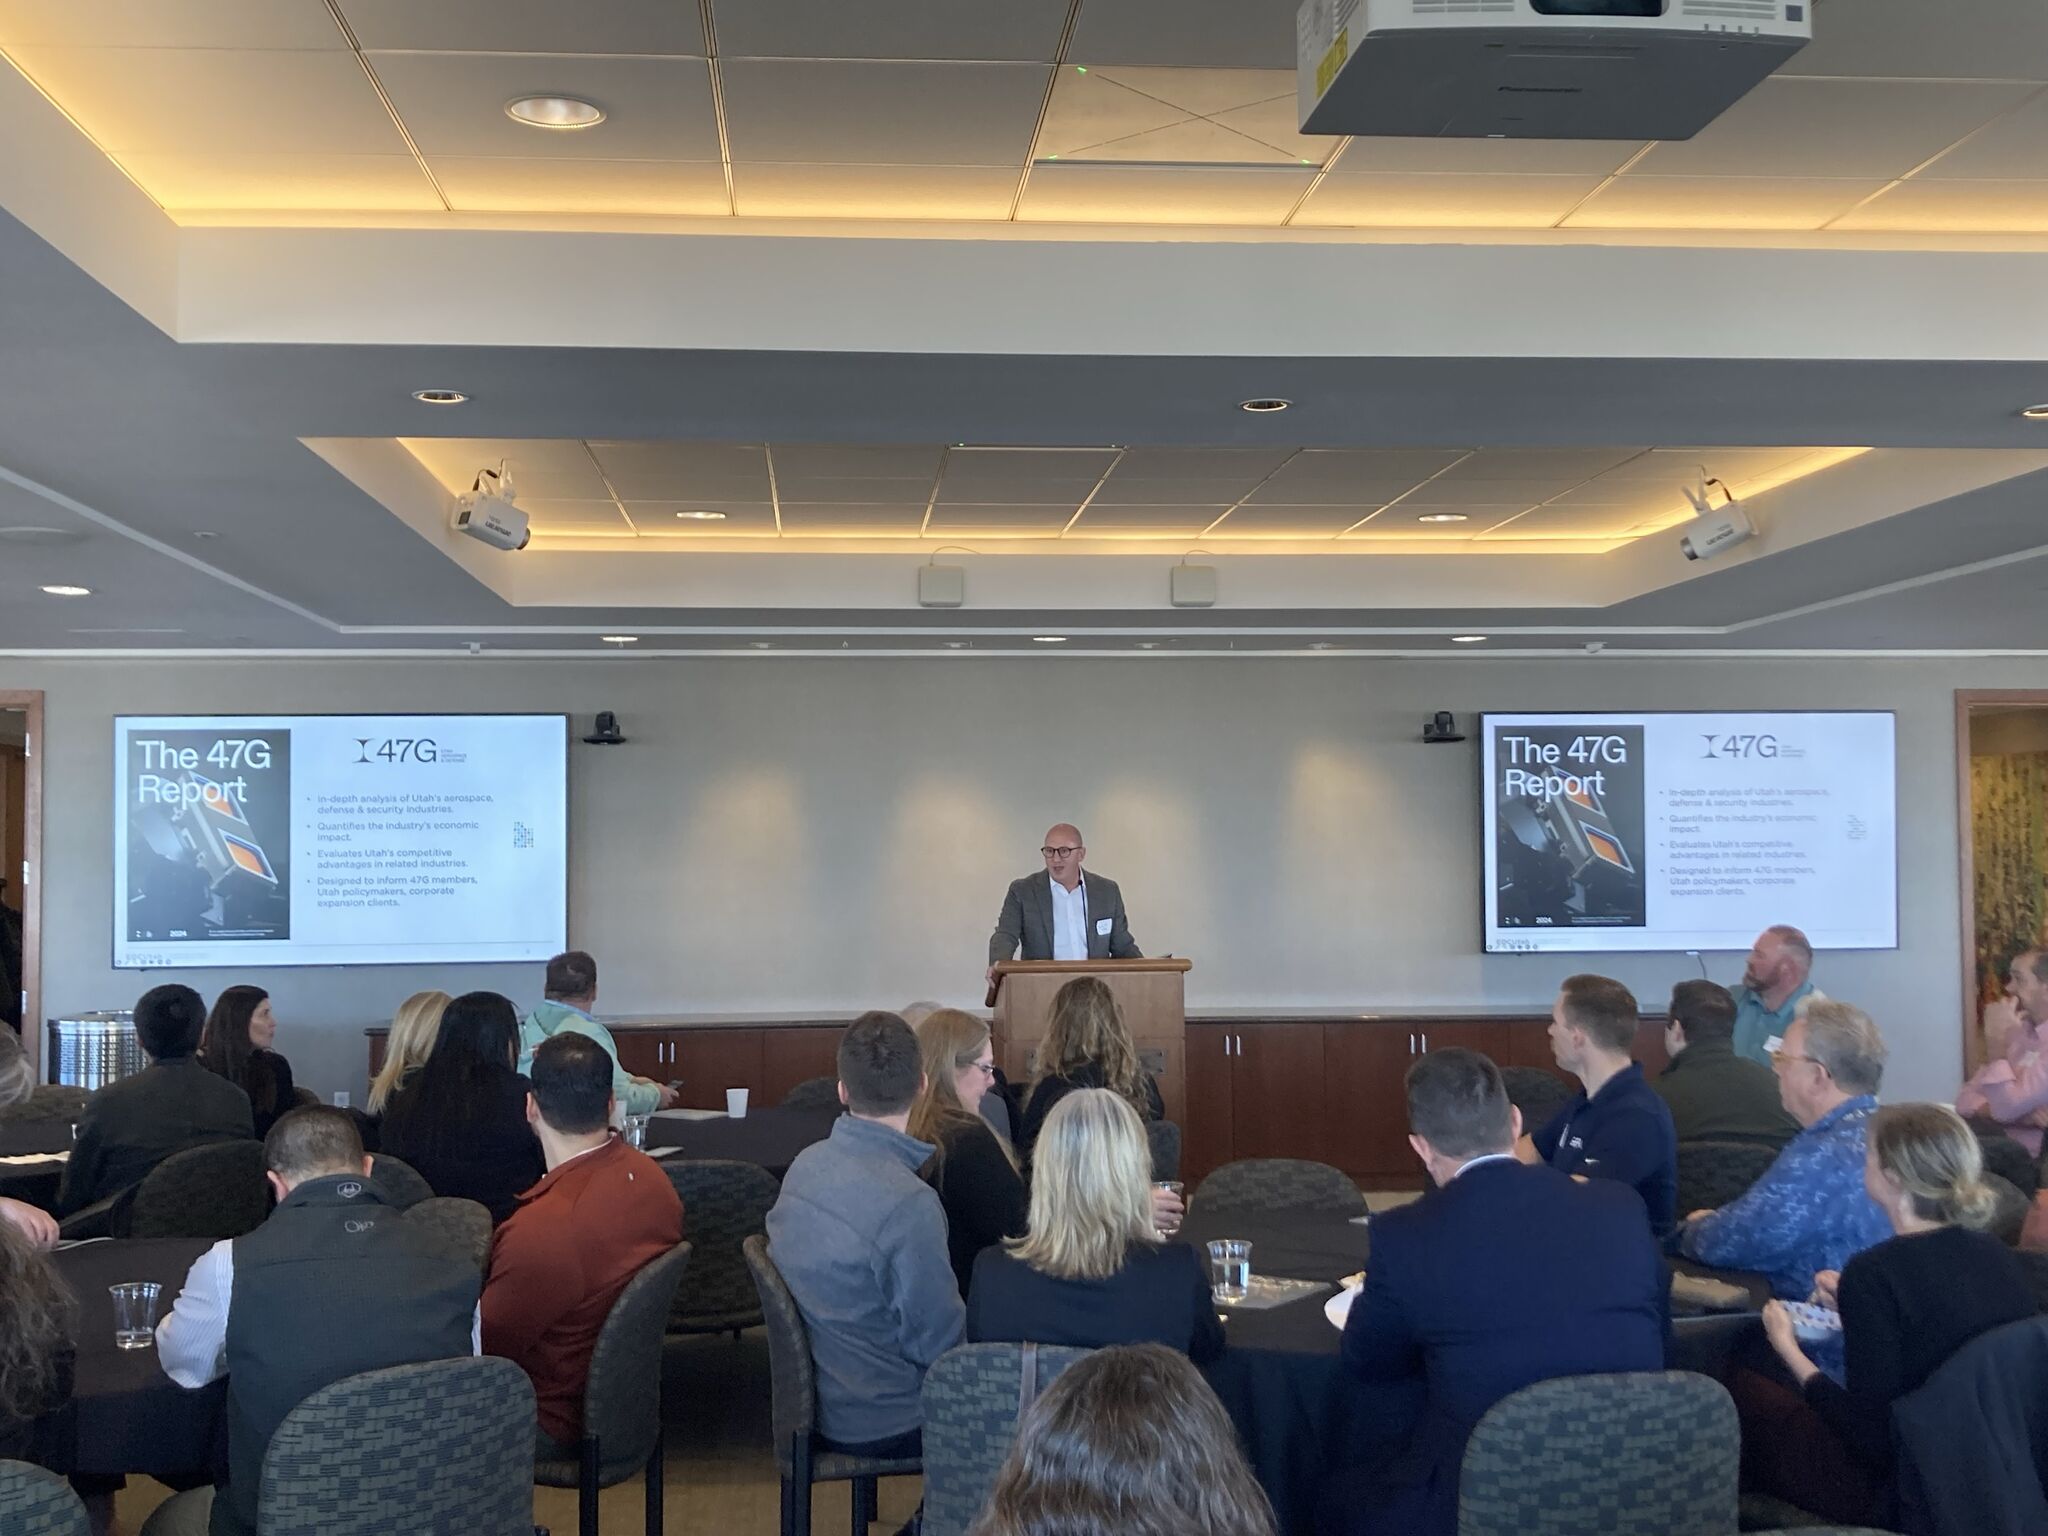
Each year, the EDCUtah research team publishes data on several key industry clusters in Utah. These industry profiles include information like cost comparisons, labor density, and key employers in the industry. More recently, 47G commissioned EDCUtah to conduct an in-depth analysis of Utah’s broader aerospace, defense, and security industries.
The 47G Report set out to quantify the economic impact of aerospace and defense activity in Utah, as well as adjacent industries such as advanced materials manufacturing and cybersecurity technology. The report also evaluates the Beehive State’s competitive advantages in related industries. It offers valuable insights to better inform 47G members, Utah policymakers, and corporate expansion clients looking to bring their aerospace, defense, and security operations to Utah.
Here are a few takeaways from the report:
The EDCUtah Research team analyzed data collected by multiple federal, state, and private organizations to examine the broader aerospace and defense industry in Utah. The broader industry includes the traditional guided missile and aerospace vehicle parts manufacturing as well as national security, space research, and their critical supply chains. Because of tech’s growing influence on aerospace and defense, sectors like artificial intelligence, cyber security, machine learning, and other activities critical to domestic and internet security are included in the analysis.
This broader definition of aerospace and defense yields impressive statistics that demonstrate its importance to Utah’s economy. In 2023, the industry:
Utah has a rich history and legacy of aerospace and defense in the state. The state is home to multiple military installations, research facilities, and private companies that contribute to the success of the industry.
Since its establishment in 1939, Hill Air Force Base has been a key installation specializing in aircraft maintenance, repair, and overhaul. It is also home to the Ogden Air Logistics Complex, which maintains and modernizs Air Force aircraft and weapon systems. Other notable military installations in Utah include Camp Williams, the Roland R. Wright National Guard Base, and the Tooele Army Depot, among others.
According to the Milken Institute, the University of Utah ranks no. 1 in the institute’s Technology Transfer and Commercialization Index and Brigham Young University ranks no. 4. This index measures a university’s efficacy of utilizing its research and development capabilities to develop new technologies that can be applied outside of the university. These two universities ranked higher than notable universities such as Stanford University and the Massachussetts Institute of Technology (MIT). Utah is also home to research facilities such as the Space Dynamics Lab at Utah State University, Falcon Hill Aerospace and Research Park, and the Dugway Proving Grounds. These facilities contribute to the advancement of space and weapons research that are critical to both the nation’s defense and Utah’s strong economy.
Finally, Utah is home to companies such as Boeing, Duncan Aviation, L3Harris, Lockheed Martin, and Northrop Grumman—many of which had at least one corporate expansion project with EDCUtah. These companies contribute to maintaining a highly skilled labor force in Utah and, in turn, benefit from the state’s significant educational assets.
EDCUtah estimated the total economic impact of the broader aerospace, defense, and security industry. This analysis is comprised of three four parts: direct, indirect, induced, and total impact.
The direct impact is the immediate, quantifiable metric in the industry. For example, the industry employs over 236,000 individuals directly in the industry. Additionally, businesses in the industry require inputs for the goods and services that they provide. In engaging with the broader economy to acquire these inputs, they create jobs and income that is captured as indirect impact. Finally, the wages of the direct and indirect employees are spent on the broader economy, creating induced impact. The total impact simply combines the direct, indirect and induced impacts to see how the industry affects the region’s economy.

The results of this analysis show that the industry has a doubling effect on employment with a multiple of 2.02. This means that every direct job in the industry results in another job due to its indirect or induced effects. While the multiples aren’t quite as large for the output and compensation numbers, they are still notable with total impacts of 1.77 and 1.86.

For a deeper dive into the aerospace, defense, and security industry in Utah, contact EDCUtah at connect@edcutah.org or 47G at contact@47g.org. This report is not yet accessible online, but a physical copy may be requested.
_____
Each month, EDCUtah’s Research Minute highlights interesting economic development data and timely research insights. Want more data? Explore the benefits of investing with EDCUtah.
For additional information or to schedule an interview, please contact us.
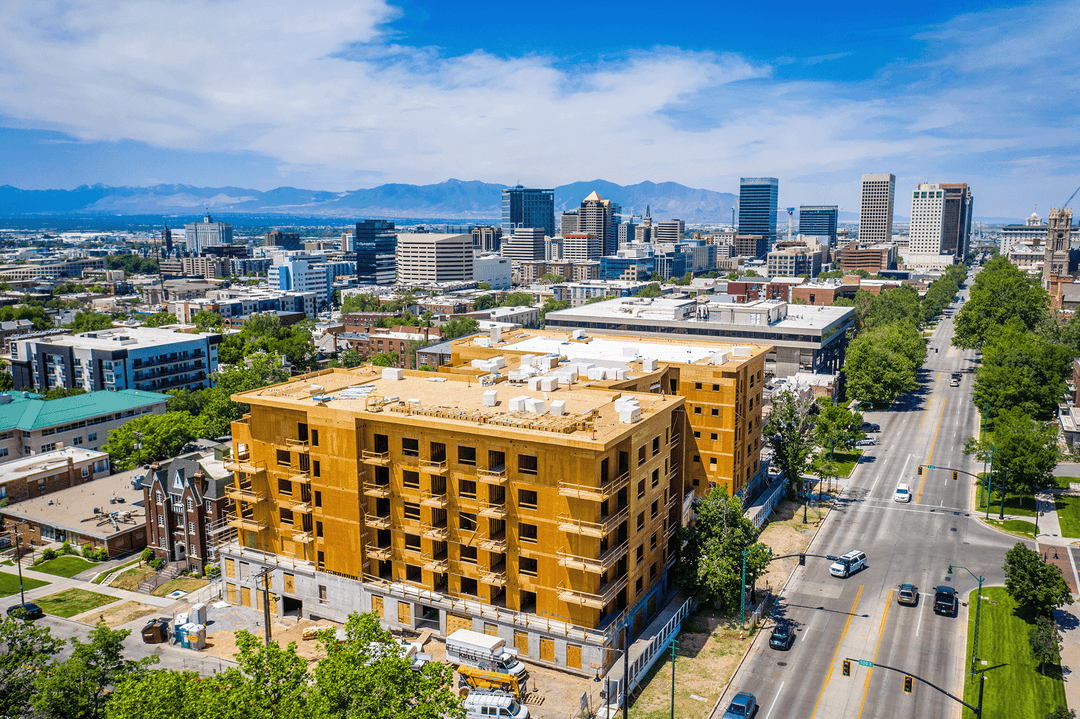
Each month, EDCUtah’s Research Minute highlights interesting economic development data and timely research insights. This month, we review rent affordability in the U.S. and how Utah compares.
Housing affordability in Utah has been a hot topic for both residents and businesses across the state. According to three different sources — Zillow, Redfin, and CoStar — residential renting became more affordable for Utahns in 2024, while becoming generally less affordable in the United States. While the cost of purchasing a home in Utah continues to rise, there is room for optimism now that rent prices have stabilized and even decreased, making the market more affordable for Utah’s renters.
Zillow and Redfin, two online real estate market and brokerage services, frequently publish reports on trends that their internal data shows in the housing market. Similarly, CoStar tracks real estate data and EDCUtah uses that data to see how these trends impact our state. Each publishes data on rent prices but they reported different changes in rent based on their data on both the national and local scale. Redfin and Zillow only use major metro areas in their analysis, so they were only able to report on the Salt Lake metro. CoStar has data on Utah’s other metro areas that show similar trends to the Salt Lake metro. This report will focus on the Salt Lake metro because of the two reports recently released by Redfin and Zillow.
Zillow, Costar, and Redfin reported rent increases of 3.5%, 1.1%, and 0.1% respectively across the nation in 2024. This variance in values is expected since each source is pulling from a different sample of real estate throughout the country. Although there is disagreement in the exact rate of rent growth across the country, there is agreement that prices are still rising and may be stabilizing from the extreme growth in prices that peaked in 2022.
Meanwhile, Zillow was the only source that saw an increase in the price of rent in the Salt Lake City metro, with only a 0.3% increase in prices, while Redfin and CoStar reported that the metro decreased rent prices by 6.5% and 1.1% respectively. Zillow ranked the Salt Lake City metro as the third most affordable metro for renters in the United States, and Redfin ranked Salt Lake City as the fourth most affordable metro in the nation.
Wages have generally increased nationwide, and Redfin’s report looked into this wage growth to better understand affordability. Using Census Bureau data, they estimated that the median income for American renters increased by 5.3% in 2024. They found this increase in median wages was greater than the increase in rent prices, thus making rent more affordable nationwide. Still, the median renter in the United States is allocating 34.9% of their income to housing expenses. For the Salt Lake City metro, Redfin determined that the median renter is allocating roughly 27.5% of their income for housing, while Zillow’s report suggests that Salt Lake City renters are able to allocate an even smaller proportion of their income to housing, at 19.9%.
CoStar suggests that the decrease in rental prices is likely due to the completion of many multifamily housing units in 2024. While this is true, 2024 also saw much fewer multi-family housing units begin construction than had begun in previous years. For Salt Lake City metro to maintain housing affordability while growing in population and opportunity, building additional units will remain important to meet growing demand.
_____
Want more data like this? Explore the benefits of investing with EDCUtah.
For additional information or to schedule an interview, please contact us.
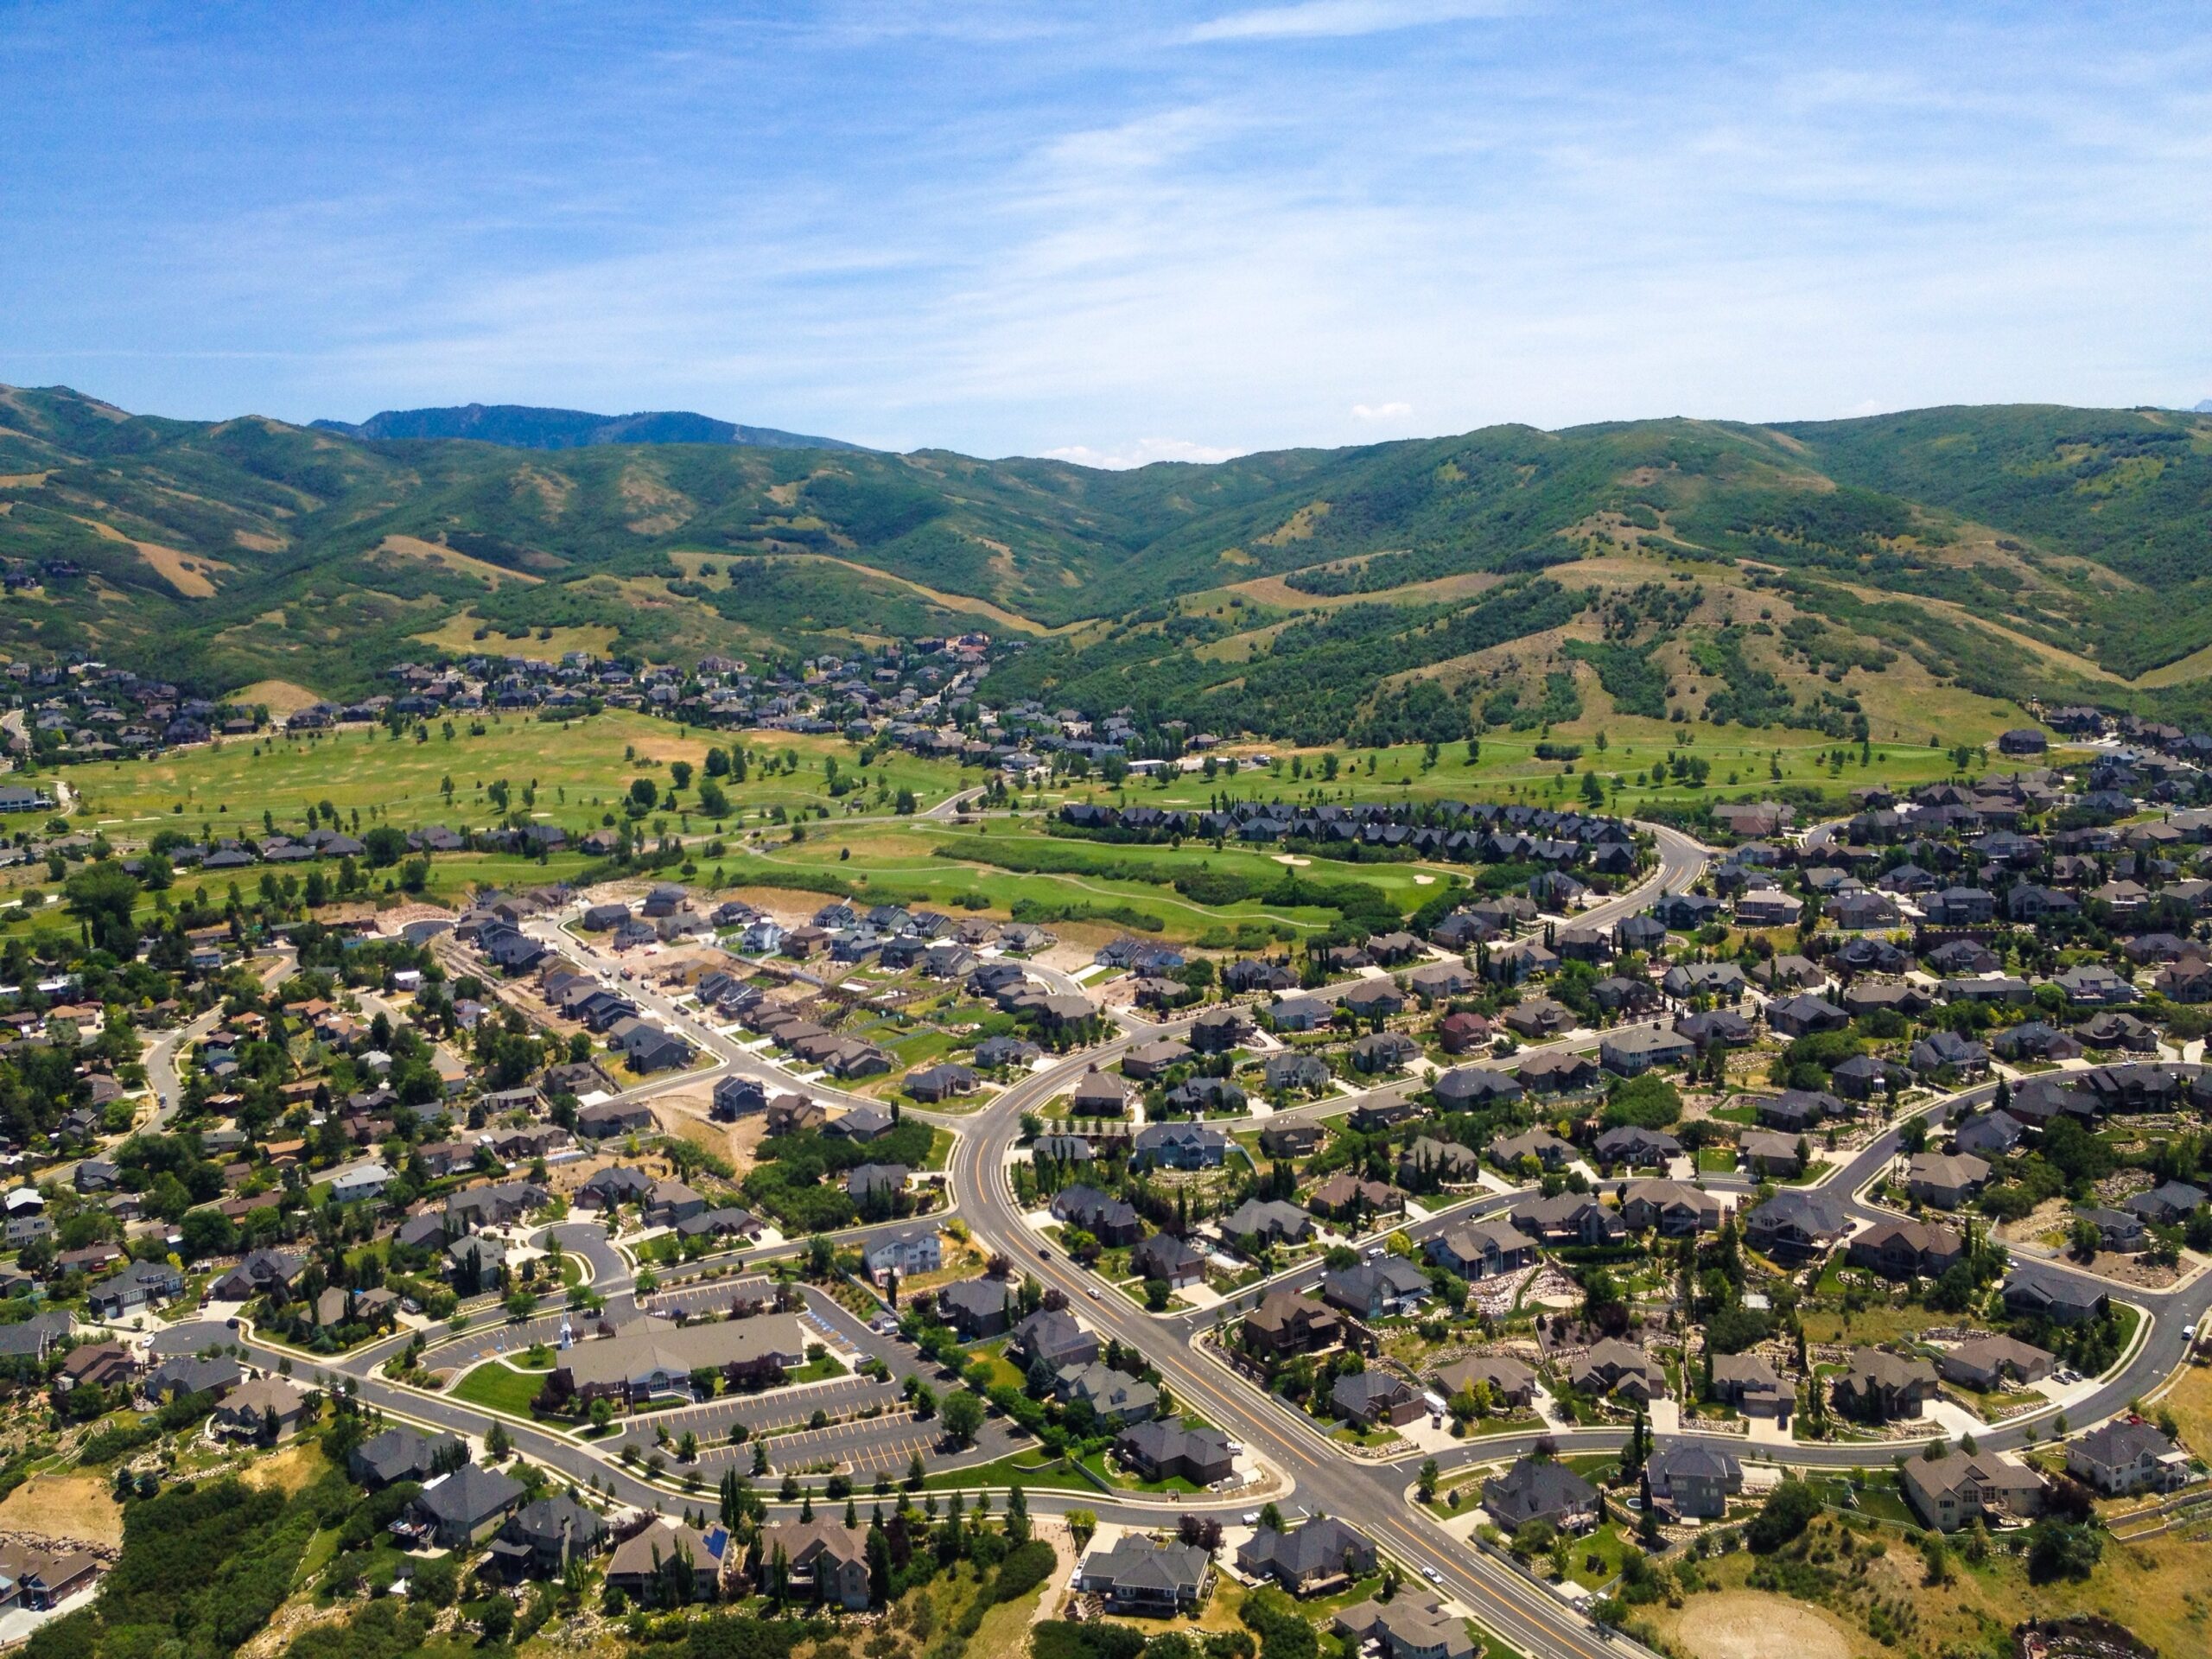
Each month, EDCUtah’s Research Minute highlights compelling economic development data and timely research insights. This month, we highlight the recently published Utah Innovation Ecosystem Report.
Utah’s broad innovation ecosystem ranks high among U.S. states across various measures, according to a new study produced jointly by EDCUtah and the Kem C. Gardner Policy Institute. The study, titled Utah Innovation Ecosystems, highlights the state’s top-ranking performance in innovation capacity and outcomes, driven by a combination of strategic strengths and industry-aligned ecosystems.
The report was commissioned by Utah Governor’s Office of Economic Opportunity and the Utah Policy Innovation Lab to examine the characteristics that contribute to the Utah’s success in innovation and identify gaps or opportunities for improvement. The results of the study offer insights that can help inform Utah’s entrepreneurs, investors, educators, and policymakers.
Here are a few takeaways from the report.
The report found that Utah ranks first in the nation on the Innovation Intelligence Index developed by the Indiana Business Research Center. This index evaluates critical attributes of innovation, including human capital and knowledge creation, business dynamics, business profile, employment and productivity, and economic well-being. Utah’s consistent performance across all these categories, ranking sixth or better in each, cements its status as a hub for innovation and economic growth.

An innovation ecosystem is the dynamic set of actors, activities, artifacts, institutions, and relationships that influence and are essential for the innovative performance of an individual or group. This includes not only direct relationships, but also complementary and substitute relationships, forming a complex and evolving environment for innovation.
Utah’s success is driven by five distinct, industry-aligned ecosystems:
These ecosystems represent varying levels of maturity but collectively contribute to the state’s competitive innovation landscape.

Utah’s potential innovation strengths and opportunities for growth were identified by conducting in-depth interviews with industry experts throughout the state as well as other qualitative analyses. Utah’s core strengths include the role of higher education in cultivating a skilled workforce, a strong culture of entrepreneurship, and the existence of social infrastructure that encourages collaboration among key stakeholders.
The report also outlines areas where Utah could further enhance its innovation ecosystems. Opportunities for growth include the further development of physical infrastructure, particularly research facilities, incubation spaces, and innovation hubs. Additionally, continuing to attract venture capital and other funding sources remains critical, especially in sectors like aeronautics, energy production, and health care.
By addressing these potential gaps, Utah has the opportunity to not only sustain but also accelerate its trajectory as a leader in innovation. The state’s strategic focus on infrastructure, funding, and collaboration will be crucial in ensuring long-term economic growth and continued success in fostering innovation and maintaining Utah’s status as one of the best states in the nation for innovation and economic growth.
_____
For more data like this, email us at connect@edcutah.org or explore the benefits of investing with EDCUtah.
For additional information or to schedule an interview, please contact us.

Each month, EDCUtah’s Research Minute highlights interesting economic development data and timely research insights. This month, we explore the Archbridge Institute’s Social Mobility score and how Utah earned the no. 1 rank in the country.
Utah ranks first in the nation for social mobility in the 2023 Social Mobility in the 50 States report published by the Archbridge Institute. For residents, this translates to a better chance of moving up the social and economic ladder in Utah than in any other state. For businesses, this makes Utah an attractive location because it gives their workforce the best opportunity to live the American dream.
Social mobility has typically referred to the ability of individuals to surpass the earnings of their parents at the same age. In their research to create a social mobility index, the Archbridge Institute included not only this intergenerational income element, but also metrics that more broadly measure one’s ability to improve their life and well-being. Archbridge Institute applied four pillars to the index:
Archbridge Institute analyzed each pillar for all 50 states and ranked them by their scores. Utah ranked no. 1 for overall social mobility, no. 4 for Entrepreneurship and Growth, no. 5 in Education and Skills Development, no. 8 in Social Capital, and no. 17 for Institutions and Rule of Law.
Each of the four pillars contained additional subcategories of measurement. While the report does not give detailed descriptions of the specific data used to generate the rankings, they can still provide insights into general areas of strength and improvement. The subcategories where Utah showed its greatest strengths were:
Utah’s lower rankings appeared in the following subcategories:
While there is room for improvement in Utah’s social mobility, it should be noted that even Utah’s lower rankings just barely fall in the bottom half of all 50 states. Utah is not far from sitting in the top half for all subcategories.
But how does the Archbridge Institute index compare to more traditional measures of social mobility? The index aligns closely with income mobility, poverty rates, and income inequality data for Utah. In a 2014 study, for example, Salt Lake City had the highest score for intergenerational mobility out of the 50 largest community zones in the country. Additionally, Utah has the nation’s second lowest poverty rate (9%) and the lowest level of income inequality as measured by the Gini Index. (Both of these Utah data comparisons use the U.S. Census Bureau’s 2023 American Community Survey 1-Year Estimates.)
Utah has proven to be a place where individuals can increase their income potential and also improve their overall standard of living and well-being. Utah is a place where people want to work, and where companies can have a meaningful impact on the lives of their employees and on the communities where they operate. Doing business in Utah not only makes financial and logistical sense for companies – it makes financial sense for employees, too.
_____
For additional information or to schedule an interview, please contact us.

Cost of living is an important issue in Utah and across the U.S., especially as inflation has had far-reaching impacts on Americans over the past few years. Some states have seen more significant changes in cost of living than others, and Utah is one of those. In 2014, Utah’s metro areas had an average cost of living index score of 93, lower than the national average of 100. In 2024, every Utah metro area has an index score over 100, with Salt Lake and St. George at 109.5 and 108.1 respectively. How is this index calculated, and what has caused the drastic increase in Utah metro areas?

The Council for Community and Economic Research (C2ER) Cost of Living Index is a quarterly publication produced and published by tC2ER, a national association of research professionals working in community and economic development. C2ER’s Cost of Living Index sheds light on changing costs across the U.S. and is nationally recognized as one of the best sources for cost of living data.
Each quarter, partner organizations all around the nation, including EDCUtah’s research team in Utah, sample prices of common goods and services. These goods and services fall into the following categories: grocery items, housing, utilities, transportation, health care, and miscellaneous goods and services. These categories are then used to produce the overall composite index score. Each category is weighted differently, according to C2ER’s methodology, as follows:

Here is how Utah’s metro area scores in each of those areas, with 100 being the national average:

Since Utah’s index scores have increased substantially over the past decade, this shows that cost of living has been more rapidly increasing in Utah compared to other locations in the United States since the score of 100 is always equal to the national average in any given quarter when the index is calculated. The two areas where Utah scores considerably higher than the national average are housing and transportation. Since housing is such a significant portion of the cost-of-living index score, and a highly significant cost for Utahns each month, it’s one of the reasons behind the high composite index score.
It’s not surprising that Utah’s much lower average composite index score of 93 in 2014 showed a much lower index score in housing and transportation, 97.1 and 101.6 respectively. While some of the other categories have also increased, none have increased so drastically as housing and transportation. According to Zillow, the median home value in Salt Lake City was $282,946 in 2016. Today, that number has increased to $548,351, an increase of 94%. Utah has seen significant increases in housing costs in all other metro areas as well, although housing costs are not growing as rapidly today. For transportation, the index measures the cost of gasoline and common automobile repairs. Those costs have steadily increased in Utah.
The entire nation has seen rising costs of living, but it has been more acute in in the Intermountain West and Utah specifically over the same period. This is a result of a variety of factors including rapid population growth and increased in-migration, microeconomic forces including housing undersupply, and a tightened labor market. Utah’s cost of living is still comparable to other major competitor metro areas, and Utah leaders are tackling rising costs with a number of strategic initiatives such as the Olene Walker Housing Loan Fund, the Low-Income Housing Tax Credit (LIHTC) Program, and other investments into affordable housing and cost of living.
Utah business leaders are also doing their part. For example, Utah Rising is a comprehensive statewide vision led by the Salt Lake Chamber in collaboration with public and private sectors. The initiative is designed to ensure sustainable economic growth, enhance quality of life, and drive prosperity across Utah by uniting diverse stakeholders around innovative, long-term solutions.
_____
For more information about the Cost of Living Index, email us at connect@edcutah.org or explore the benefits of investing with EDCUtah.
For additional information or to schedule an interview, please contact us.
Data Source: C2ER Cost of Living Index

EDCUtah’s Research Minute highlights interesting economic development data and timely research insights. This month, we explore productivity by industry in Utah.
An analysis of Utah’s most productive industries reveals interesting insight into what cities, counties, and the state might consider when planning for the future and targeting expansion and development opportunities.
What qualifies as a productive industry, you ask? Productivity is the total industry output (gross domestic product, plus the value of products and services used as inputs to produce other products and services) divided by industry employment. The measure is used to estimate the dollar amount per employee, per year for an industry. The higher the dollar amount, the more productive a hypothetical employee would be in that industry.
Any increase in productivity leads to economic growth as measured by GDP, and improved economic growth diversifies industry and raises wages thus improving the standard of living. Higher productivity also often means greater impact to communities in tax revenue, higher quality jobs, and a greater multiplier effect for economic growth.
EDCUtah’s research team analyzed all 96 3-digit NAICS (North Atlantic Industry Classification System) codes in the state to determine which industries contribute most to economic growth and prosperity. To do this, EDCUtah considered metrics like productivity, employment, labor density, GDP per employee, gross surplus, and the cost of labor.
In the analysis, the most productive industries tended to be the industries with the highest GDP per employee and the highest gross surplus. This makes sense because GDP is used in the calculation for those metrics. Some of the most productive industries in Utah have high employment, and some don’t. Utah has a competitive labor density for some of these industries, but not for others. The cost of labor for the most productive industries tended to be higher than those of less productive industries, since those industries generally required higher skilled labor.
Petroleum and Coal Product Manufacturing is based on the transformation of crude petroleum and coal into usable products. The process for petroleum refining involves the separation of crude petroleum into component products using complex methods. Utah has a relatively low employment in this industry, with only about 1,800 employees statewide, but a high labor density, since this industry does not have high employment nationwide. Nevertheless, this industry has grown rapidly over the last five years (+108.9% growth) and produces an astounding $1.7 million in GDP per employee.
Contrast this industry with Food Services and Drinking Places, with 119,000 employees and only $37,000 GDP per employee, and it’s clear that some industries are far more productive than others. These two industries produce roughly similar GDP, despite one having less than 2% of the employment compared to the other.
It makes sense that some industries are not highly productive. Social assistance and residential and nursing care services do not exist to produce a product output, but to provide necessary community care. The same can be said for other institutions, like museums and historical sites, which exist to serve the public and offer cultural enrichment.
Additionally, many municipal leaders prioritize attracting retailers as part of their economic development efforts. While retail industries typically rank low in productivity, GDP per employee, and gross surplus, they can provide a significant source of local sales tax revenue. Retail and service industries also contribute to a community’s livability and workforce diversification.
Productivity data can provide community leaders with an alternative lens for assessing developable areas and evaluating their economic development plans. Some communities might choose to increase their investment in real estate and infrastructure to attract non-retail commercial businesses. Other communities may not be interested in new industry development. Prosperity and “good growth” look different for every community – that’s why EDCUtah collaborates with community leaders to understand their unique needs and help them achieve their economic development goals.
_____
For more information about how industries performed in this analysis, email us at connect@edcutah.org or explore the benefits of investing with EDCUtah.
For additional information or to schedule an interview, please contact us.
Data Sources: JobsEQ, US Bureau of Economic Analysis, US Bureau of Labor Statistics.
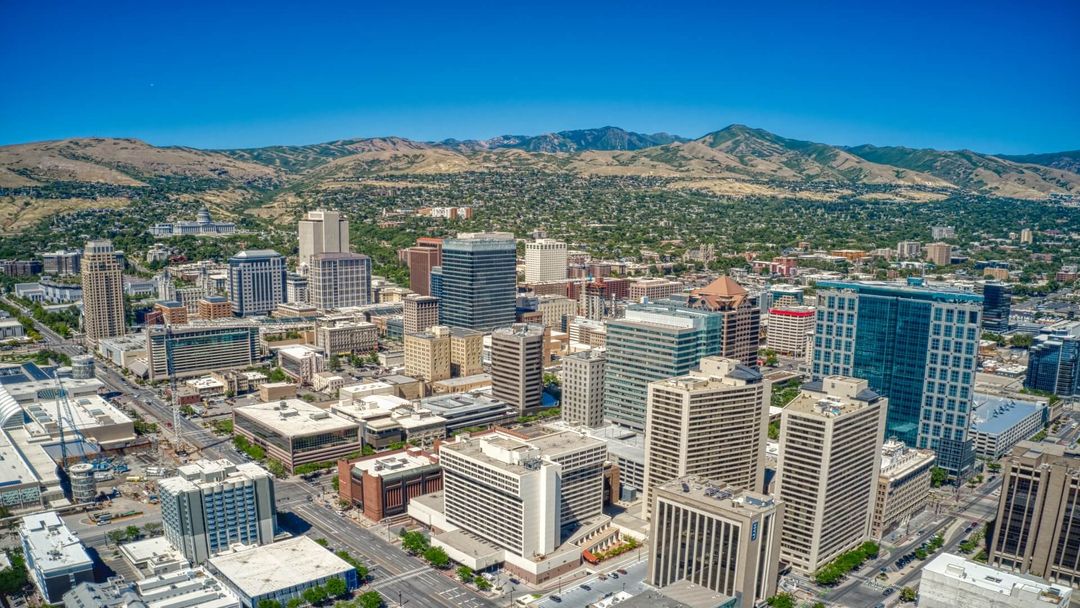
Each month, EDCUtah’s Research Minute highlights interesting economic development data and timely research insights. This month, we explore Utah’s economic outlook and national rankings.
The U.S. News and World Report recently ranked Utah as the best state in the nation for the second year in a row. Their “Best States” ranking uses thousands of data points across multiple categories to make their determination. Utah ranked in the top 15 states in low crime, education, healthcare, economy, fiscal stability, and infrastructure.
Utah receives recognition from other outlets as well. Utah ranked #1 for the 17th year in a row in economic outlook by Rich States Poor States. WalletHub ranked Utah as the #1 state to start a business in 2024, as well as the #2 best state economy. Why is the economy of Utah so successful, despite national and international economic and geopolitical worries?
Utah’s culture of innovation and hard work continues to be a boon for the state. According to the Kem C. Gardner Policy Institute, Utah has the highest labor force participation rate in the nation. Utah also has the ninth-lowest unemployment rate, the second-lowest poverty rate, and the second-highest median household income.
Utah’s stellar job growth was the highest in the nation for a decade, growing at a staggering rate of 32.9 percent—more than double the national average. The state’s job growth dipped over the past year, but it’s still the 11th fastest annual job growth in the nation. Utah has the youngest population in the nation by a wide margin, making it a great place for employers to find motivated and hardworking workers.
Businesses continue to see Utah’s economy as a good investment. National and international companies like Campbell Soup Company, Delta Airlines, Nature’s Bakery, Proctor & Gamble, and Texas Instruments continue to expand in Utah, bringing thousands of high-quality jobs and billions in capital investment. And Utah’s business-friendly environment, commitment to fiscal responsibility, and high quality of life continue to make Utah a great place to live, work, and play.
_____
Want more data like this? Explore the benefits of investing with EDCUtah.
For additional information or to schedule an interview, please contact us.
Data Source: JobsEQ, unless otherwise noted.
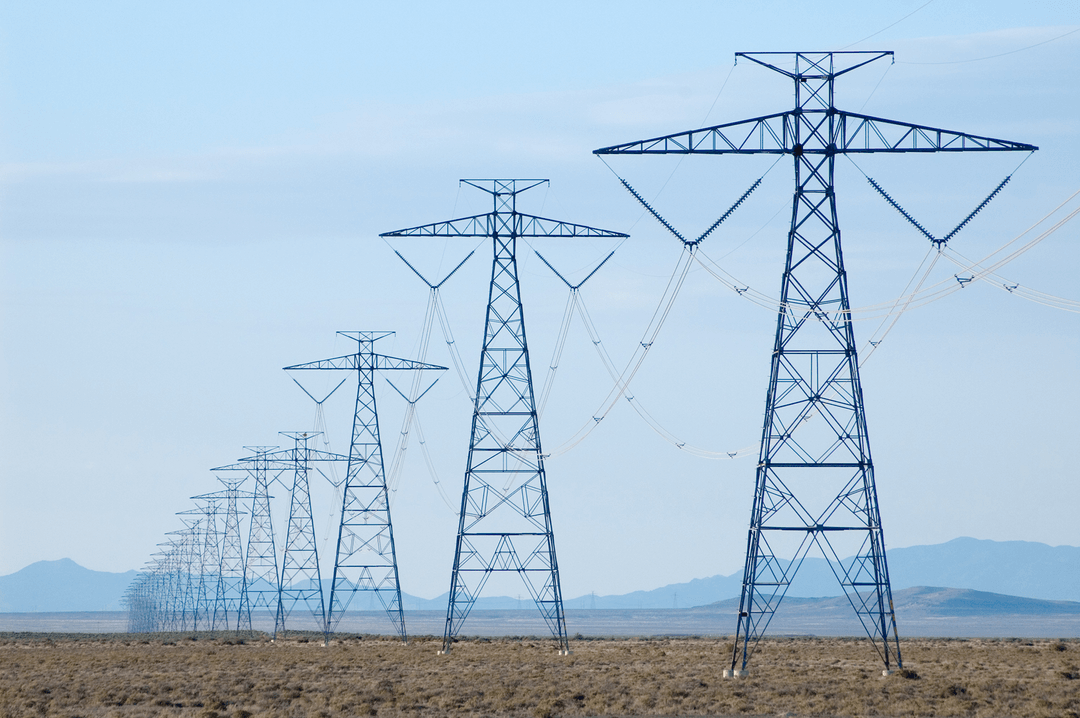
Each month, EDCUtah’s Research Minute highlights interesting economic development data and timely research insights. This month, we explore energy costs in Utah compared to the nation.
For many years, Utah has enjoyed relatively low energy costs, for both electricity and natural gas, compared to many other states in the U.S. This is true for residential, commercial, and industrial consumers. EDCUtah routinely provides energy cost data to businesses and site selectors considering Utah for expansion, and lower energy costs have been a significant driver for corporate relocation projects to Utah from high-cost states such as California and New York.
According to the U.S. Energy Information Administration, Utah has the fourth lowest electricity costs in the nation for all sectors at 9.03 cents per kilowatt hour—behind North Dakota, Wyoming, and Louisiana. In states with higher costs, residents and businesses may pay double or even triple this amount. Hawaii’s cost per kilowatt hour is 38.7, and California is at 24.73 cents per kilowatt hour. For high energy users, these costs can be more than prohibitive; they could mean the difference between success and failure as a business. In 2023, Utah also ranked fourth in the nation for cheapest natural gas costs in all sectors, behind Idaho, North Dakota, and South Dakota. However, natural gas rates have fluctuated in Utah and other states in recent months.
High inflation in the energy sector continues to be a major hurdle for residents and businesses. Energy prices rose 4.4% from January to February in 2024, registering the highest monthly increase since August 2023, according to the U.S. Bureau of Labor Statistics compiled Producer Price Index in February.
While Utah is not immune to this inflation, residents and businesses continue to enjoy relatively low energy costs in all sectors. New data shows that Utah may become the cheapest state in the nation for energy in 2024. According to an analysis of federal data, Utah is projected to have the lowest electricity rates in the nation in 2024, with the annual costs estimated to be $1,047.27 per resident. This is significantly lower than high-cost states, like Hawaii at $3,450.55, as well as the national average of $1,730.55 per resident.
Utah’s cost-effective energy can be attributed to a mixed portfolio approach to energy that includes wind, hydroelectric, and solar, according to representatives of Rocky Mountain Power. Rocky Mountain Power and Dominion Energy are the two primary electricity and natural gas providers in Utah and are committed to keeping energy affordable. Diversity and redundancy help keep Utah energy costs low. Coal and natural gas continue to be the highest producers of electricity in Utah, but renewable generation, including hydro, wind, solar, and other sources account for 359,000 MWh, increasing every year.
_____
For more information, including a breakdown of rates by category, email us at connect@edcutah.org or explore the benefits of investing with EDCUtah
For additional information or to schedule an interview, please contact us..